ECharts 4开始支持dataset组件用于单独的数据集声明,这样数据可以单独管理,被多个组件复用,并且可以基于数据指定数据到视觉的映射。
ECharts 4之前,数据只能声明在各个系列中
    xAxis: {
        type: 'category',
        data: ['Matcha Latte', 'Milk Tea', 'Cheese Cocoa', 'Walnut Brownie']
    },
    yAxis: {}
    series: [
        {
            type: 'bar',
            name: '2015',
            data: [89.3, 92.1, 94.4, 85.4]
        },
        {
            type: 'bar',
            name: '2016',
            data: [95.8, 89.4, 91.2, 76.9]
        },
        {
            type: 'bar',
            name: '2017',
            data: [97.7, 83.1, 92.5, 78.1]
        }
    ]
但是随着dataset的引入,数据管理发生改变。
入门示例
option = {
legend: {},
tooltip: {},
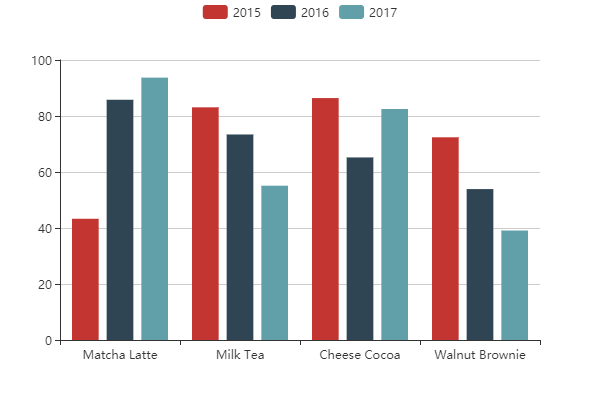
dataset: {
// 提供一份数据。
source: [
['product', '2015', '2016', '2017'],
['Matcha Latte', 43.3, 85.8, 93.7],
['Milk Tea', 83.1, 73.4, 55.1],
['Cheese Cocoa', 86.4, 65.2, 82.5],
['Walnut Brownie', 72.4, 53.9, 39.1]
]
},
// 声明一个 X 轴,类目轴(category)。默认情况下,类目轴对应到 dataset 第一列。
xAxis: {type: 'category'},
// 声明一个 Y 轴,数值轴。
yAxis: {},
// 声明多个 bar 系列,默认情况下,每个系列会自动对应到 dataset 的每一列。
series: [
{type: 'bar'},
{type: 'bar'},
{type: 'bar'}
]
}
或者使用对象数组方式指定
option = {
    legend: {},
    tooltip: {},
    dataset: {
        // 这里指定了维度名的顺序,从而可以利用默认的维度到坐标轴的映射。
        // 如果不指定 dimensions,也可以通过指定 series.encode 完成映射,参见后文。
        dimensions: ['product', '2015', '2016', '2017'],
        source: [
            {product: 'Matcha Latte', '2015': 43.3, '2016': 85.8, '2017': 93.7},
            {product: 'Milk Tea', '2015': 83.1, '2016': 73.4, '2017': 55.1},
            {product: 'Cheese Cocoa', '2015': 86.4, '2016': 65.2, '2017': 82.5},
            {product: 'Walnut Brownie', '2015': 72.4, '2016': 53.9, '2017': 39.1}
        ]
    },
    xAxis: {type: 'category'},
    yAxis: {},
    series: [
        {type: 'bar'},
        {type: 'bar'},
        {type: 'bar'}
    ]
};